Plot Voltammogram or Chronoamperogram from the (Spectro)Electrochemical Experiment
Source:R/plot_ECh_VoC_amperogram.R
plot_ECh_VoC_amperogram.RdVisualization of electrochemical responses like
voltammogram or chronoamperogram
either by ggplot2 (static plot) or by plotly
interactive package. The corresponding data frame for the plot can be created from the ASCII text file,
generated by the potentiostat electrochemical instrument, using the fread function
(see also section Examples).
Usage
plot_ECh_VoC_amperogram(
  data.vat,
  x = "E_V",
  x.unit = "V",
  Current = "I_uA",
  Current.unit = "uA",
  xlim = NULL,
  Ilim = NULL,
  line.color = "darkviolet",
  line.width = 0.75,
  line.type = 1,
  theme.basic = "theme_gray",
  axis.title.size = 15,
  axis.text.size = 14,
  border.line.color = "black",
  border.line.width = 0.5,
  border.line.type = 1,
  ref.electrode = NULL,
  plot.interact = FALSE,
  ticks = "out",
  grid = TRUE
)
Arguments
- data.vat
Data frame (table) object, including required columns like
Potential(\(E\)) and/orTime(\(t\)) as well asCurrent(\(I\)). Even though an arbitrary column label can be used, the best option is to use labels e.g.E_V,E_mV,time_s,I_uAorI_mA.- x
Character string, pointing to
x-axis/column quantity, in the originaldata.vat, like potential (e.g.x = "E_V",x = "E_mV") or time (e.g.x = "time_s",x = "time_min"orx = "time_ms"). Default:x = "E_V"(potential in volts).- x.unit
Character string, pointing to
x-quantity unit. There are following units available:x.unit = "V",x.unit = "mV"(in case of voltammetry,xcorresponds to potential) as well asx.unit = "s",x.unit = "ms"orx.unit = "min"(in case of chronoamperometry,xcorresponds to time). Default:x.unit = "V".- Current
Character string, indicating the
Current(\(I\))-axis/column quantity in the originaldata.vatobject. Default:Current = "I_ua"(current in \(\text{µA}\)).- Current.unit
Character string, pointing to
Currentquantity unit likeCurrent.unit = "uA"(microamps, default),Current.unit = "A",Current.unit = "mA"andCurrent.unit = "nA".- xlim
Numeric vector of the
x-quantity lower and upper visual limit, e.g.xlim = c(-100,400)(potential in "mV", in case of voltammetry) orxlim = c(0,1000)(time in seconds, in case of chronoamperometry). Default:xlim = NULLactually setting the entirex-range from the original dataset.- Ilim
Numeric vector, characterizing the lower and upper visualization limit of the current, e.g.
Ilim = c(-0.05,0.2), corresponding to current in milliamps. Default:Ilim = NULLrelated to the entire current (\(I\)) range from the original dataset.- line.color
Character string, pointing to line color of the voltammogram / chronoamperogram. All
{ggplot2}compatible colors are allowed, e.g.line.color = "blue". Default:line.color = "darkviolet".- line.width
Numeric, linewidth of the plot line in
mm, default:line.width = 0.75.- line.type
Character string or integer, corresponding to width of the voltammogram/chronoamperogram line. Following types can be specified:
0 = "blank",1 = "solid"(default),2 = "dashed",3 = "dotted",4 = "dotdash",5 = "longdash"and6 = "twodash".- theme.basic
Character string, calling a
ggplottheme base. Following themes are defined:"theme_gray"(default one) => gray background with the white grid lines
"theme_bw"=> white background with thin gray grid lines, the theme is suggested for publications
"theme_light"=> similar to
theme_bw()but without the pronounced axis black lines"theme_classic"=> without grid, pronounced axis lines, however without opposite ones
"theme_linedraw"=> pronounced axis lines (both for the origin and the opposite) as well as the grid ones, theme is suggested for publications if the
gridis set toFALSE
- axis.title.size
Numeric, axis text title size in
pt. Default:axis.title.size = 15.- axis.text.size
Numeric, text size in
ptfor the axes unit values/descriptions, default:axis.text.size = 14.- border.line.color
Character string, referring to color of the plot graph/panel border line. Default:
border.line.color = "black".- border.line.width
Numeric, width (in
mm) of the plot graph/panel border line, default:border.line.width = 0.5.- border.line.type
Character string or integer, corresponding to width of the plot graph/panel border line. Following types can be specified:
0 = "blank",1 = "solid"(default),2 = "dashed",3 = "dotted",4 = "dotdash",5 = "longdash"and6 = "twodash".- ref.electrode
Character string, corresponding to reference electrode notiation/label, e.g.
ref.electrode = "Ag-quasiref"orref.electrode = "Fc/Fc+". Default:ref.electrode = NULL(displayed potential is not related to anyref.electrode).- plot.interact
Logical, whether the voltammogram or chronoamperogram is visualized as an interactive plot by
{plotly}(plot.interact = TRUE). Default:plot.interact = FALSE(static plot by{ggplot2}is displayed).- ticks
Character string, corresponding to pointing direction of the axis ticks, either pointing into the panel graph or outwards (default). If
ticks = "in"also the opposite axis ticks are displayed.- grid
Logical, whether to display the
gridwithin the panel/graph, default:grid = TRUE.
Value
Graphical representation (list object) of voltammogram or chronoamperogram either in static
form by {ggplot2} (plot.interact = FALSE) or in interactive form by {plotly}
(plot.interact = TRUE).
References
Bard AJ, Faulkner LR, White HS (2022). Electrochemical methods: Fundamentals and Applications, 3rd edition. John Wiley and Sons, Inc., ISBN 978-1-119-33405-7, https://www.wiley.com/en-us/9781119334064.
Pingarrón JM, Labuda J, Barek J, Brett CMA, Camões MF, Fojta M, Hibbert DB (2020). “Terminology of Electrochemical Methods of Analysis (IUPAC Recommendations 2019).” Pure and Appl. Chem., 92(4), 641–694. https://doi.org/10.1515/pac-2018-0109.
Neudeck A, Petr A, Dunsch L (1999). “The redox mechanism of Polyaniline Studied by Simultaneous ESR–UV–vis Spectroelectrochemistry.” Synth. Met., 107(3), 143–158, https://doi.org/10.1016/S0379-6779(99)00135-6.
Elgrishi N, Rountree KJ, McCarthy BD, Rountree ES, Eisenhart TT, Dempsey JL (2018). “A Practical Beginner’s Guide to Cyclic Voltammetry.” J. Chem. Educ., 95(2), 197–206, https://doi.org/10.1021/acs.jchemed.7b00361.
See also
Other EPR Spectroelectrochemistry:
eval_ECh_QNe_chronoamp()
Examples
## loading package built-in example file =>
## `.txt` file generated by the IVIUM potentiostat software
triarylamine.path.cv <-
load_data_example(file = "Triarylamine_ECh_CV_ivium.txt")
## the data frame contains following variables:
## time, desired potential, current and the actual/applied
## potential
triarylamine.data.cv <-
data.table::fread(file = triarylamine.path.cv,
skip = 2,
col.names = c("time_s",
"E_V_des", # desired potential
"I_A",
"E_V_app") # applied potential
)
## data frame preview
head(triarylamine.data.cv)
#> time_s E_V_des I_A E_V_app
#> <num> <num> <num> <num>
#> 1: 0.0 0.0000 -3.95429e-08 -0.000251648
#> 2: 0.5 0.0025 -3.35184e-08 0.002265060
#> 3: 1.0 0.0050 -2.92210e-08 0.004787570
#> 4: 1.5 0.0075 -2.54160e-08 0.007305210
#> 5: 2.0 0.0100 -2.19019e-08 0.009820580
#> 6: 2.5 0.0125 -1.82987e-08 0.012332400
#
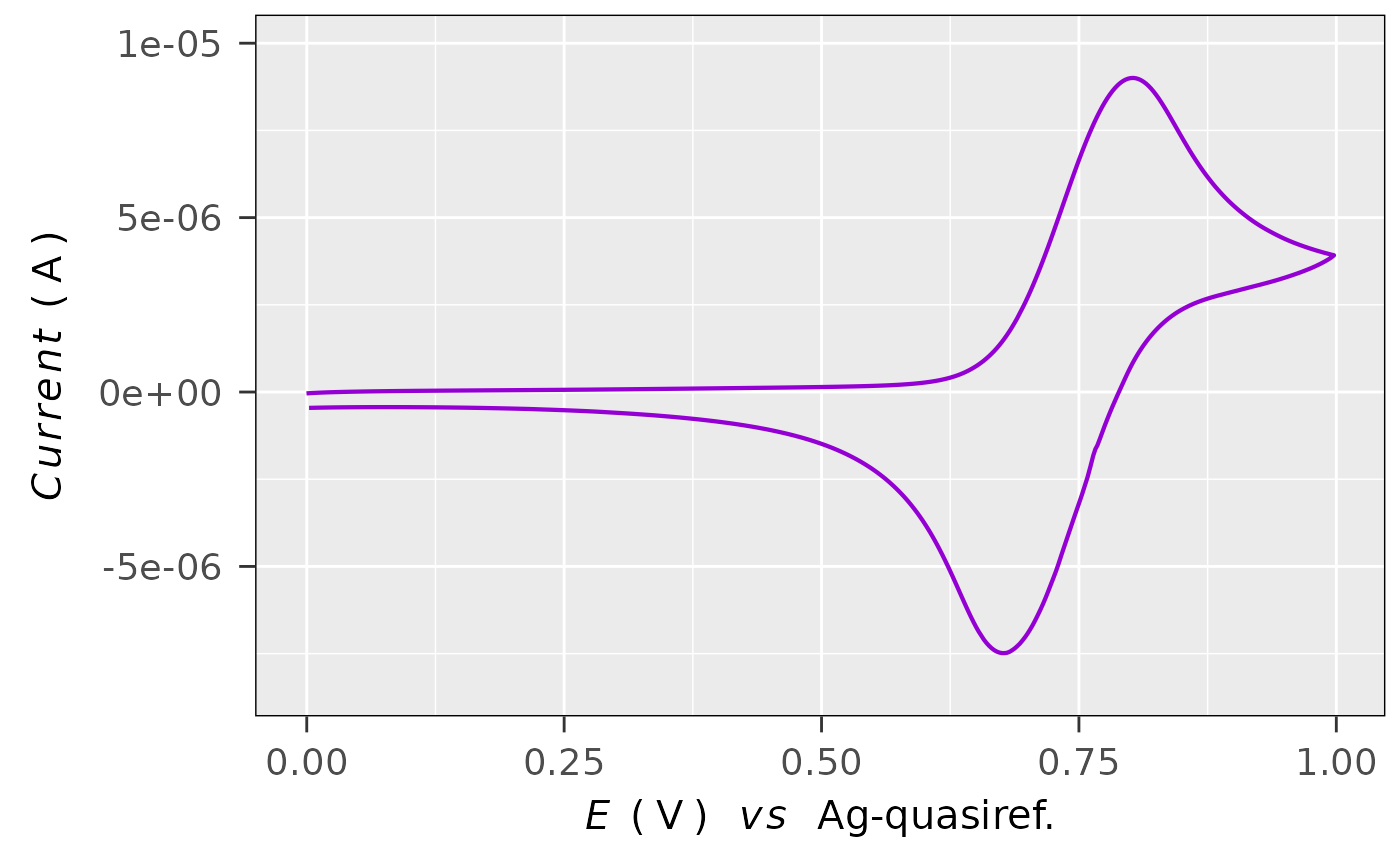
## simple voltammogram plot with ref. electrode string:
plot_ECh_VoC_amperogram(data.vat =
triarylamine.data.cv,
x = "E_V_app",
Current = "I_A",
Current.unit = "A",
ref.electrode = "Ag-quasiref."
)
 #
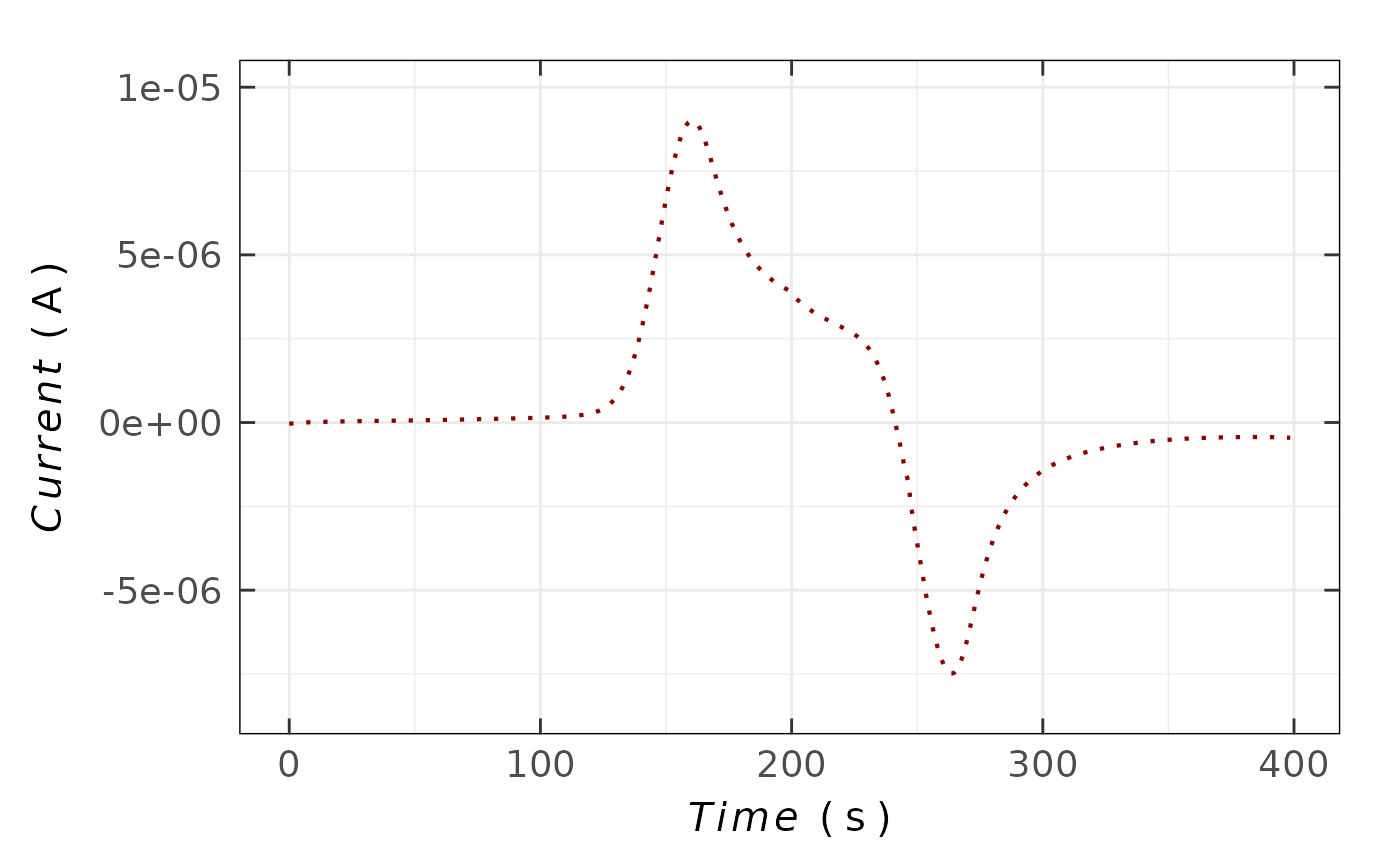
## simple chronoamperogram plot with "theme_bw" theme
## and `ticks` pointing into the graph panel (ticks = "in")
plot_ECh_VoC_amperogram(data.vat = triarylamine.data.cv,
x = "time_s",
x.unit = "s",
Current = "I_A",
line.color = "darkred",
line.type = 3,
Current.unit = "A",
theme.basic = "theme_bw",
ticks = "in"
)
#
## simple chronoamperogram plot with "theme_bw" theme
## and `ticks` pointing into the graph panel (ticks = "in")
plot_ECh_VoC_amperogram(data.vat = triarylamine.data.cv,
x = "time_s",
x.unit = "s",
Current = "I_A",
line.color = "darkred",
line.type = 3,
Current.unit = "A",
theme.basic = "theme_bw",
ticks = "in"
)
 #
## simple interactive "darkgreen" voltammogram
plot_ECh_VoC_amperogram(data.vat = triarylamine.data.cv,
x = "E_V_app",
Current = "I_A",
Current.unit = "A",
line.color = "darkgreen",
plot.interact = TRUE
)
#
## simple interactive "darkgreen" voltammogram
plot_ECh_VoC_amperogram(data.vat = triarylamine.data.cv,
x = "E_V_app",
Current = "I_A",
Current.unit = "A",
line.color = "darkgreen",
plot.interact = TRUE
)